Building Interactive Data Dashboards with Python and Dash: A Comprehensive Guide
In the modern data-driven landscape, the ability to effectively communicate insights is as crucial as the analysis itself. Static charts and lengthy reports often fail to capture the dynamic nature of data. This is where interactive web applications come in, transforming passive data consumption into an active, exploratory experience. For Python developers, data scientists, and machine learning engineers, Plotly’s Dash framework has emerged as a powerful solution for building sophisticated, production-ready analytical applications without needing to be a front-end expert.
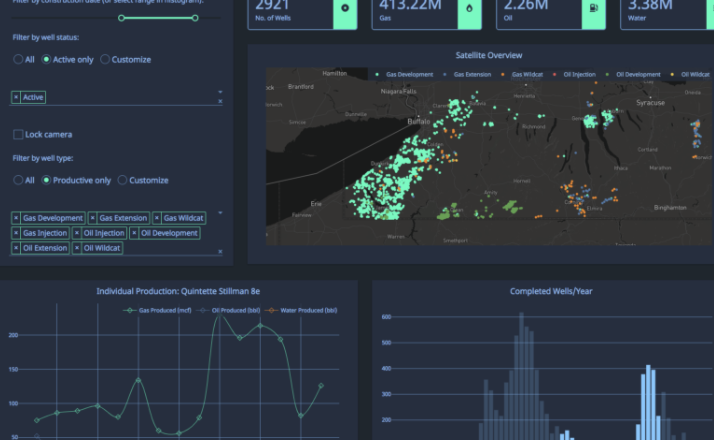
Dash provides a pure Python framework for creating highly interactive web-based dashboards. Built on top of Flask, Plotly.js, and React.js, Dash abstracts away the complexities of web development, allowing you to build rich user interfaces with familiar Python code. Unlike notebook environments like Google Colab, Dash applications are standalone web servers, making them easily shareable and deployable. Whether you’re visualizing results from a model trained with PyTorch News or TensorFlow News, creating a monitoring dashboard for experiments tracked in MLflow News, or building a business intelligence tool, Dash provides the components and flexibility to bring your data to life. This article provides a comprehensive guide to mastering Dash, from fundamental concepts to advanced techniques and deployment best practices.
The Core Anatomy of a Dash Application
At its heart, a Dash application is composed of two primary parts: the layout, which describes what the application looks like, and the callbacks, which define the application’s interactivity. Understanding these core components is the first step toward building powerful dashboards.
Key Libraries: Dash, Dash Core Components, and Dash HTML Components
To get started with Dash, you’ll primarily work with three key libraries from the Plotly ecosystem:
- dash: The main library that includes the `Dash` class to initialize your application.
- dash_core_components (dcc): Provides higher-level interactive components like dropdowns, sliders, graphs, and more. The `dcc.Graph` component is used to render Plotly figures.
- dash_html_components (html): Provides Python wrappers for every HTML tag, such as `html.Div`, `html.H1`, `html.P`, allowing you to structure your application’s content semantically.
The layout of a Dash app is a tree of these components. You define this structure declaratively, which Dash then renders as a web page.
Building Your First Static Dashboard
Let’s start by creating a simple, non-interactive dashboard. This example will initialize a Dash app, define a layout with a title and a Plotly bar chart, and run the development server. We’ll use pandas to create a sample DataFrame for our visualization.
# app.py
import dash
from dash import dcc, html
import plotly.express as px
import pandas as pd

# 1. Initialize the Dash app
app = dash.Dash(__name__)

# 2. Create a sample DataFrame
df = pd.DataFrame({
    "Fruit": ["Apples", "Oranges", "Bananas", "Grapes"],
    "Amount": [4, 1, 2, 2],
    "City": ["SF", "SF", "Montreal", "Montreal"]
})

# 3. Create a Plotly figure
fig = px.bar(df, x="Fruit", y="Amount", color="City", barmode="group",
             title="Fruit Distribution by City")

# 4. Define the app layout
app.layout = html.Div(children=[
    html.H1(children='My First Dash Dashboard'),

    html.Div(children='''
        A simple example of a static data visualization.
    '''),

    dcc.Graph(
        id='example-graph',
        figure=fig
    )
])

# 5. Run the app
if __name__ == '__main__':
    app.run_server(debug=True)
To run this application, save the code as `app.py` and execute `python app.py` in your terminal. You can then access your dashboard at `http://127.0.0.1:8050/`. This simple example demonstrates how easily you can embed a rich, interactive Plotly chart within a web page structure using only Python.
Unleashing Interactivity with Callbacks
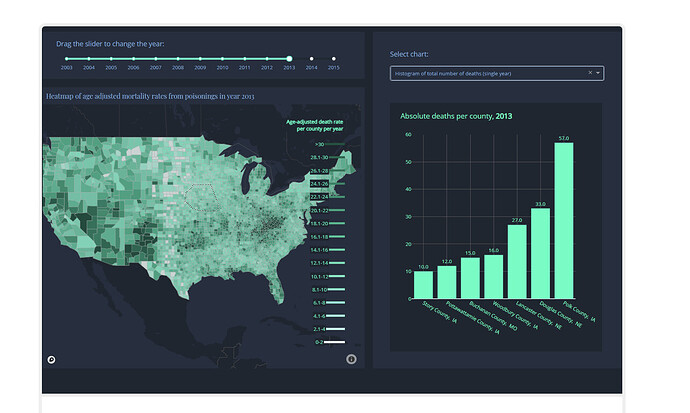
The true power of Dash lies in its callback mechanism, which allows you to connect user interface components to your Python code. Callbacks are Python functions that are automatically called by Dash whenever an input component’s property changes. This enables you to create dynamic applications where user actions, like selecting an item from a dropdown or moving a slider, trigger updates to graphs, tables, or other elements on the page.
The @app.callback Decorator
Callbacks are defined using the `@app.callback` decorator. This decorator links `Output` and `Input` components. The arguments to the decorator describe which properties of which components serve as inputs and outputs to the callback function.
- `Output`: Defines the component and property that will be updated by the function’s return value. (e.g., the `figure` of a `dcc.Graph`).
- `Input`: Defines the component and property that will trigger the function when it changes. (e.g., the `value` of a `dcc.Dropdown`).
Example: An Interactive Data Filtering Dashboard
Let’s extend our previous example to make it interactive. We will add a `dcc.Dropdown` that allows the user to filter the data by city. The bar chart will then dynamically update to show data for the selected city.
# app_interactive.py
import dash
from dash import dcc, html
from dash.dependencies import Input, Output
import plotly.express as px
import pandas as pd

# Initialize the Dash app
app = dash.Dash(__name__)

# Create a sample DataFrame
df = pd.DataFrame({
    "Fruit": ["Apples", "Oranges", "Bananas", "Grapes", "Apples", "Oranges"],
    "Amount": [4, 1, 2, 2, 2, 4],
    "City": ["SF", "SF", "Montreal", "Montreal", "NYC", "NYC"]
})

# Define the app layout
app.layout = html.Div([
    html.H1("Interactive City Fruit Dashboard"),

    html.Label("Select a City:"),
    dcc.Dropdown(
        id='city-dropdown',
        options=[{'label': i, 'value': i} for i in df['City'].unique()],
        value='SF' # Initial value
    ),

    dcc.Graph(id='fruit-bar-chart')
])

# Define the callback to update the graph
@app.callback(
    Output('fruit-bar-chart', 'figure'),
    Input('city-dropdown', 'value')
)
def update_graph(selected_city):
    # Filter the dataframe based on the selected city
    filtered_df = df[df.City == selected_city]

    # Create the figure with the filtered data
    fig = px.bar(filtered_df, x='Fruit', y='Amount',
                 title=f'Fruit Distribution in {selected_city}')

    fig.update_layout(transition_duration=500) # Smooth transition

    return fig

# Run the app
if __name__ == '__main__':
    app.run_server(debug=True)
In this example, whenever the `value` of the `dcc.Dropdown` with `id=’city-dropdown’` changes, Dash calls the `update_graph` function. The new dropdown value is passed as the `selected_city` argument. The function filters the DataFrame, creates a new Plotly figure, and returns it. Dash then automatically updates the `figure` property of the `dcc.Graph` component with `id=’fruit-bar-chart’`. This simple pattern is the foundation for almost all interactivity in Dash.
Advanced Techniques for Complex Applications
As your dashboards grow in complexity, you’ll need more advanced patterns to manage state, handle complex user interactions, and integrate external processes like machine learning models. Dash provides several features to support these sophisticated use cases.
Chaining Callbacks and Using Multiple Inputs/Outputs
A single callback can have multiple `Input` and `Output` components. This is useful for creating forms or dashboards where one action should update several elements simultaneously. Furthermore, you can “chain” callbacks, where the output of one callback becomes the input for another, creating a dependent workflow.
For example, you could have one dropdown to select a country, which then populates the options of a second dropdown for selecting a city within that country. This is a common pattern for creating dynamic, cascading filters.
Integrating Machine Learning Models
Dash is an excellent tool for creating user interfaces for machine learning models. You can build dashboards that allow users to input parameters, run a prediction, and visualize the results in real-time. This is particularly valuable for stakeholder demonstrations or for creating internal tools for model exploration. This approach is frequently used in projects managed on platforms like AWS SageMaker News or Azure Machine Learning News to provide a user-friendly front-end to complex models.
In the following example, we’ll create a simple dashboard for a pre-trained scikit-learn regression model. The user can adjust input features using sliders, and the app will display the model’s prediction.
# app_ml.py
import dash
from dash import dcc, html
from dash.dependencies import Input, Output
import pandas as pd
from sklearn.ensemble import RandomForestRegressor
from sklearn.model_selection import train_test_split

# --- ML Model Training (run once) ---
# In a real app, you would load a pre-trained model (e.g., with pickle or joblib)
# For this example, we train a dummy model on startup.
df = pd.DataFrame({
    'feature1': range(100),
    'feature2': [x * 0.5 for x in range(100)],
    'target': [x * 2 for x in range(100)]
})
X = df[['feature1', 'feature2']]
y = df['target']
model = RandomForestRegressor(n_estimators=10, random_state=42)
model.fit(X, y)
# --- End Model Training ---

app = dash.Dash(__name__)

app.layout = html.Div([
    html.H1("Machine Learning Model Interface"),
    html.P("Adjust the sliders to see the model's prediction."),

    html.Div([
        html.Label("Feature 1:"),
        dcc.Slider(id='feature1-slider', min=0, max=100, step=1, value=50),
    ]),

    html.Div([
        html.Label("Feature 2:"),
        dcc.Slider(id='feature2-slider', min=0, max=50, step=0.5, value=25),
    ]),

    html.Hr(),
    html.H3("Model Prediction:"),
    html.Div(id='prediction-output', style={'fontSize': 24, 'fontWeight': 'bold'})
])

@app.callback(
    Output('prediction-output', 'children'),
    [Input('feature1-slider', 'value'),
     Input('feature2-slider', 'value')]
)
def predict(feature1, feature2):
    # Create a DataFrame for the single prediction
    input_data = pd.DataFrame([[feature1, feature2]], columns=['feature1', 'feature2'])

    # Get the prediction from the model
    prediction = model.predict(input_data)[0]

    return f'{prediction:.2f}'

if __name__ == '__main__':
    app.run_server(debug=True)
This application provides an intuitive way to interact with a trained model, making the model’s behavior transparent and accessible to non-technical users. This same principle can be applied to complex models from frameworks like Keras News or for visualizing data processed by libraries like LangChain News.
Best Practices, Styling, and Optimization
Building a functional dashboard is one thing; building a robust, performant, and user-friendly one is another. Following best practices is key to creating professional-grade Dash applications.
Structuring Large Applications
For complex dashboards, a single `app.py` file can become unwieldy. Dash supports multi-page applications and a modular structure. The recommended approach is to split your app into multiple files:
- `app.py`: The main entry point. It should only contain the `dash.Dash` app instantiation and the server run command.
- `index.py`: Handles the URL routing and the main layout that swaps pages in and out.
- `layouts.py`: Contains the layout definitions for each page.
- `callbacks.py`: Contains the callback definitions for each page.
This separation of concerns makes your code more maintainable, scalable, and easier to debug.
Styling with Dash Bootstrap Components
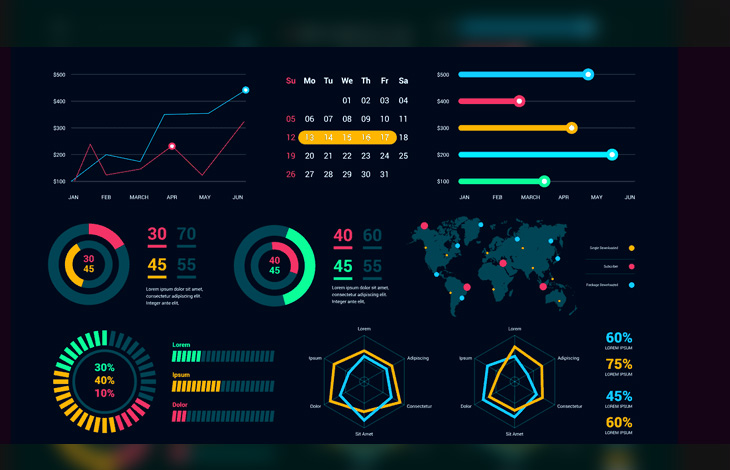
While you can style Dash apps with custom CSS, the `dash-bootstrap-components` library provides a much faster way to build professional-looking layouts. It gives you access to the entire Bootstrap component suite (like `Row`, `Col`, `Card`, `Navbar`) directly within your Python layout code, enabling you to create responsive, grid-based designs with ease.
Performance Optimization
As your data volume and computation complexity grow, performance can become a concern. Here are a few key optimization strategies:
- Memoization: For callbacks that perform expensive computations (e.g., querying a large database or running a complex simulation), use caching mechanisms like `functools.lru_cache` to store and reuse results for identical inputs.
- Clientside Callbacks: For UI interactions that don’t require the Python backend (e.g., toggling a modal or updating a text field based on a dropdown), you can write callbacks in JavaScript that run directly in the user’s browser. This reduces server load and eliminates network latency, resulting in a snappier user experience.
- Data Pruning: Avoid sending massive amounts of data to the browser. Perform aggregations and filtering on the server-side within your callbacks and only send the data necessary for the visualization.
Keeping an eye on performance is crucial, especially when deploying dashboards for a wider audience, whether on-premise or on cloud platforms like Vertex AI News or Amazon Bedrock News.
Conclusion
Dash empowers Python developers to bridge the gap between data analysis and web development, enabling the creation of powerful, interactive, and professional-grade analytical applications. By mastering the core concepts of layouts and callbacks, you can transform complex datasets and machine learning models into intuitive, accessible tools. We’ve explored the fundamentals of building a static dashboard, unlocked interactivity with callbacks, delved into advanced techniques like ML model integration, and covered best practices for creating robust and performant applications.
The journey doesn’t end here. The Dash ecosystem is rich with possibilities, including extensions for creating complex multi-page apps, integrating with WebGL for high-performance visualizations, and a vibrant community creating third-party components. As you continue to build, you’ll find that Dash is not just a dashboarding tool but a complete framework for building data-centric applications that can drive insight and decision-making across any organization.


