Data Visualization

Why I Moved My Trading Dashboards to Local Streamlit Apps
I was staring at a completely frozen Jupyter notebook last Tuesday at 11 PM, trying to figure out why my custom ranking radar charts were eating 14GB of.

Building a Streamlit Market Copilot That Actually Works
Financial news aggregators have a massive noise-to-signal problem, especially when tech stocks suddenly drop 8% while the broader market stays flat.
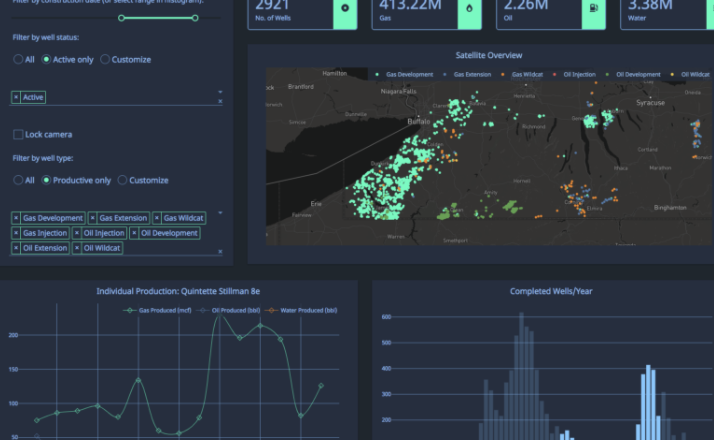
Building Interactive Data Dashboards with Python and Dash: A Comprehensive Guide
In the modern data-driven landscape, the ability to effectively communicate insights is as crucial as the analysis itself.

Building an AI News Analysis Dashboard with Python and Dash: A Developer’s Guide
From Raw Data to Real-Time Insights: Crafting an Interactive News Dashboard with Dash In today’s hyper-connected world, staying informed is both a.