The Industrialization of AI: Why MLOps Platforms Like Weights & Biases are Becoming Mission-Critical Infrastructure
The artificial intelligence landscape is undergoing a seismic shift. We’ve moved beyond the era of academic experimentation and into a phase of industrial-scale development and deployment. As foundation models grow in size and complexity, and as enterprises race to integrate AI into their core products, the underlying infrastructure that supports the machine learning lifecycle has become more critical than ever. Recent industry buzz, including major acquisition talks in the MLOps space, underscores a vital trend: the tools that enable developers to build, track, and reproduce AI models are no longer a “nice-to-have” but are fundamental pillars of the modern tech stack. This is where MLOps platforms, and specifically tools like Weights & Biases, enter the spotlight.
This article delves into the technical capabilities of Weights & Biases (W&B), exploring why it has become an indispensable tool for researchers and engineers at leading organizations from OpenAI and NVIDIA to Meta AI. We will explore its core functionalities, from basic experiment tracking to advanced hyperparameter optimization and model versioning, providing practical code examples and best practices. Understanding these tools is essential for anyone working with modern frameworks like PyTorch, TensorFlow, JAX, or the rapidly evolving ecosystem of LLM tools like LangChain and LlamaIndex.
Understanding the Core of MLOps: Experiment Tracking
At its heart, machine learning is an empirical science. Progress is made through iterative experimentation: adjusting model architectures, tweaking hyperparameters, and curating datasets. Without a systematic way to track these experiments, the process quickly descends into chaos. This is the fundamental problem that Weights & Biases solves. It acts as a centralized, collaborative logbook for all your ML experiments, capturing everything needed for analysis and reproducibility.
Key Components of Experiment Tracking
- Metrics: Quantitative measures of performance, such as loss, accuracy, F1-score, or perplexity. W&B allows you to log these metrics over time (e.g., per epoch or per batch) and visualize them in real-time dashboards.
- Hyperparameters: The configuration settings for an experiment, including learning rate, batch size, optimizer type, and model depth. Logging these ensures you know the exact conditions that produced a given result.
- Artifacts: Any input or output of your training process, such as datasets, model weights, or evaluation results. W&B provides robust versioning for these artifacts, which is crucial for reproducibility and production handoffs.
- System Monitoring: Automatic tracking of hardware utilization, including GPU temperature, power usage, and memory allocation. This is invaluable for identifying performance bottlenecks, especially when working with powerful hardware discussed in NVIDIA AI News.
A Practical Example: Basic Tracking in PyTorch
Integrating W&B into a standard training loop is remarkably straightforward. Let’s look at a simple example using PyTorch to train a basic neural network. First, you need to install the library (pip install wandb) and log in from your terminal (wandb login).
import torch
import torch.nn as nn
import torchvision
import torchvision.transforms as transforms
import wandb

# 1. Start a new run
wandb.init(
    # Set the project where this run will be logged
    project="pytorch-intro",
    # Track hyperparameters and run metadata
    config={
        "learning_rate": 0.01,
        "architecture": "SimpleCNN",
        "dataset": "CIFAR-10",
        "epochs": 5,
    })

# Capture the config for convenience
config = wandb.config

# Simulate a training loop
device = "cuda" if torch.cuda.is_available() else "cpu"
model = nn.Sequential(nn.Linear(784, 128), nn.ReLU(), nn.Linear(128, 10)).to(device)
criterion = nn.CrossEntropyLoss()
optimizer = torch.optim.Adam(model.parameters(), lr=config.learning_rate)

# Dummy data loader for demonstration
train_loader = [(torch.randn(64, 784).to(device), torch.randint(0, 10, (64,)).to(device)) for _ in range(100)]

# 2. Log metrics from your training loop
for epoch in range(config.epochs):
    epoch_loss = 0.0
    for data, target in train_loader:
        optimizer.zero_grad()
        output = model(data)
        loss = criterion(output, target)
        loss.backward()
        optimizer.step()
        epoch_loss += loss.item()
        # Log metrics to W&B
        wandb.log({"batch_loss": loss.item()})

    avg_loss = epoch_loss / len(train_loader)
    print(f"Epoch {epoch+1}, Avg. Loss: {avg_loss:.4f}")
    # Log epoch-level metrics
    wandb.log({"epoch": epoch + 1, "avg_loss": avg_loss})

# 3. Mark the run as finished
wandb.finish()
In this example, wandb.init() starts a new experiment run. The config dictionary stores our hyperparameters. Inside the training loop, wandb.log() sends metrics to the W&B servers, where they are instantly plotted on your project dashboard. Finally, wandb.finish() marks the run as complete. This simple integration provides immense value, replacing messy spreadsheets or text files with a clean, interactive, and shareable interface.
Deeper Integrations and Advanced Logging
While logging simple metrics is powerful, the real value of a platform like W&B emerges when you start tracking more complex aspects of your model’s behavior. This is where integrations with popular libraries like those featured in Hugging Face Transformers News or visualization tools become critical.
Logging Rich Media and Custom Visualizations
Modern ML involves more than just numbers. You might need to visualize image predictions, listen to generated audio, or inspect complex data structures like confusion matrices. W&B supports logging a wide variety of media types.
For instance, when working with computer vision models, you can log image predictions alongside their ground truth labels to visually inspect model performance. Here’s how you might log a set of images with their predicted and actual captions.
import wandb
import numpy as np
from PIL import Image

# Assume you have a batch of images and their corresponding labels/predictions
# images: a batch of PIL Image objects or numpy arrays
# true_labels: a list of ground truth strings
# pred_labels: a list of predicted strings

# Example dummy data
images = [Image.fromarray((np.random.rand(64, 64, 3) * 255).astype('uint8')) for _ in range(4)]
true_labels = ["cat", "dog", "car", "tree"]
pred_labels = ["cat", "cat", "truck", "tree"]

# Create a W&B Table to log the data
my_table = wandb.Table(columns=["Image", "Ground Truth", "Prediction"])

for img, true_label, pred_label in zip(images, true_labels, pred_labels):
    # Add data to the table row by row
    my_table.add_data(wandb.Image(img), true_label, pred_label)

# Log the entire table to your W&B run
wandb.log({"predictions_table": my_table})
This code creates an interactive table in the W&B UI, allowing you to sort, filter, and inspect your model’s qualitative performance. This capability is invaluable for error analysis and is a feature that sets it apart from more basic tools. This same principle applies to logging confusion matrices, ROC curves, or custom Plotly charts, providing a comprehensive view of your model’s behavior.
Seamless Integration with the Hugging Face Ecosystem
The Hugging Face ecosystem is central to modern NLP and beyond. W&B offers a tight integration that requires minimal code changes. By setting an environment variable (WANDB_LOG_MODEL=true) or adding a callback, you can automatically log all metrics, model checkpoints, and results from the Hugging Face Trainer API. This is a prime example of how the MLOps layer is becoming deeply embedded in high-level frameworks, reflecting a broader trend seen in PyTorch News and TensorFlow News where developer experience is paramount.
Advanced Techniques: Hyperparameter Sweeps and Artifact Management
Beyond tracking individual experiments, MLOps platforms must facilitate two critical, higher-level tasks: systematically exploring the hyperparameter space and managing the lifecycle of models and data. W&B addresses these with Sweeps and Artifacts.
Automating Optimization with W&B Sweeps
Hyperparameter tuning is often one of the most time-consuming parts of the ML workflow. W&B Sweeps provide a powerful and flexible way to automate this process. You define a search space in a YAML or Python dictionary, and W&B’s servers coordinate multiple “agents” (your training scripts) to explore this space using strategies like random search, grid search, or Bayesian optimization.
Here’s how you would define a sweep configuration in Python and launch an agent to run it. This is a powerful alternative to manual tuning or using other libraries like Optuna.
import wandb
import time

# 1. Define the sweep configuration
sweep_config = {
    'method': 'random',  # Can be 'grid', 'random', or 'bayes'
    'metric': {
      'name': 'validation_accuracy',
      'goal': 'maximize'
    },
    'parameters': {
        'optimizer': {
            'values': ['adam', 'sgd']
        },
        'learning_rate': {
            'distribution': 'uniform',
            'min': 0.0001,
            'max': 0.1
        },
        'dropout': {
            'distribution': 'uniform',
            'min': 0.1,
            'max': 0.5
        },
    }
}

# 2. Initialize the sweep
sweep_id = wandb.sweep(sweep_config, project="hyperparam-sweeps")

# 3. Define your training function that will be called by the agent
def train_function():
    # Initialize a new W&B run for each trial
    with wandb.init() as run:
        config = wandb.config
        # Simulate a training process using the hyperparameters
        print(f"Training with lr={config.learning_rate}, optimizer={config.optimizer}...")
        time.sleep(2) # Simulate work
        # Simulate a result
        validation_accuracy = 0.8 + (config.learning_rate * 0.1) - (config.dropout * 0.2) + np.random.randn() * 0.05

        # Log the result
        wandb.log({'validation_accuracy': validation_accuracy})

# 4. Start the sweep agent
# This will continuously ask the W&B server for the next set of hyperparameters to try
wandb.agent(sweep_id, function=train_function, count=5) # Run 5 trials
The W&B dashboard for sweeps provides powerful visualizations, such as parallel coordinate plots and parameter importance charts, helping you quickly identify which hyperparameters have the most impact on your model’s performance. This systematic approach is essential for achieving state-of-the-art results and is a core practice at institutions like Google DeepMind.
Ensuring Reproducibility with W&B Artifacts
A model is more than just its code; it’s a product of the code, the data, the environment, and the specific weights. W&B Artifacts allow you to version all of these components. You can log a dataset as an artifact, then have your training runs consume that specific version. The resulting model weights can then be logged as a new artifact, creating a complete, traceable lineage from data to model. This is the bedrock of true reproducibility and is critical for debugging, collaboration, and deploying models to production environments on platforms like AWS SageMaker, Vertex AI, or Azure Machine Learning. It also provides a clear audit trail, which is increasingly important for responsible AI development.
Best Practices and the Broader AI Ecosystem
As the AI industry matures, the integration of tools like W&B into a broader ecosystem becomes paramount. The insights gained from experiment tracking directly inform downstream processes, from model optimization to deployment.
Tips for Effective MLOps
- Structure Your Projects: Use a consistent naming convention for projects, runs, and tags. Use tags to denote important runs, such as `baseline`, `production-candidate`, or `failed-experiment`.
- Automate Everything: Integrate MLOps logging directly into your CI/CD pipelines. Automatically trigger evaluation runs and log results when new code is merged.
- Track More Than Just Metrics: Use artifacts to version your datasets and models. This is non-negotiable for any serious project. Log code state by ensuring your Git repository is clean when you start a run.
- Leverage Centralized Dashboards: Create reports in W&B to compare key experiments and share findings with your team. This transforms the tool from a personal logbook into a collaborative research hub.
The value of this structured approach extends across the entire AI stack. For instance, after identifying the best model architecture through tracked experiments, you can use tools like TensorRT or OpenVINO for optimization. The performance uplift from these tools can be logged back to W&B as a new run, providing a complete picture of the model’s journey. When deploying, services like NVIDIA Triton Inference Server or platforms like Modal and Replicate can serve the versioned model artifact, ensuring that what you deploy is exactly what you tested. This tight coupling between experimentation and production is the hallmark of a mature MLOps strategy, a topic frequently discussed in MLflow News and other MLOps community updates.
Conclusion: The Future is Integrated
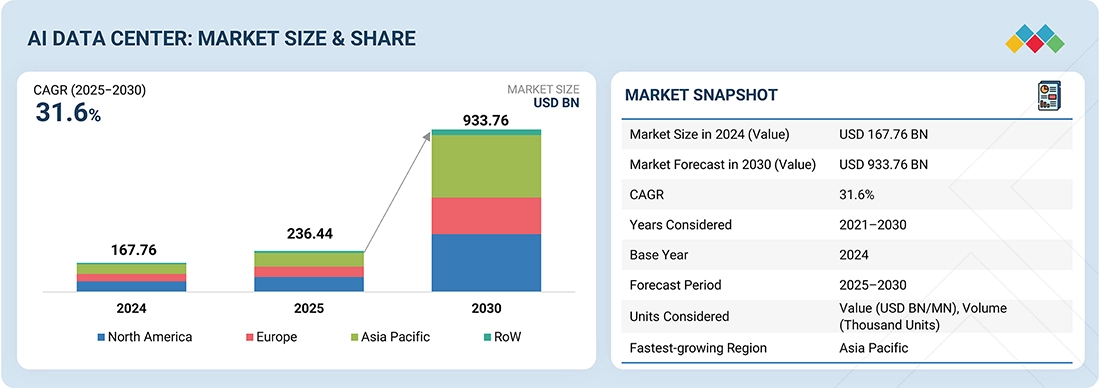
The growing consolidation in the AI infrastructure market, highlighted by recent news and acquisitions, signals a clear trend: the lines between hardware, cloud, and MLOps are blurring. Companies are realizing that providing GPUs is not enough; they must also provide the software ecosystem that makes those GPUs productive. Platforms like Weights & Biases have become the de facto operating system for machine learning development, providing the critical layer of abstraction and control needed to manage the complexity of modern AI.
For developers and data scientists, mastering these tools is no longer optional. A deep understanding of experiment tracking, hyperparameter optimization, and artifact versioning is as fundamental as knowing how to build a neural network in PyTorch or TensorFlow. As the industry continues to scale, the teams that can iterate the fastest and most reliably will be the ones that succeed. The robust, integrated, and collaborative workflows enabled by platforms like Weights & Biases are the engine that will drive that success, turning the promise of AI into tangible, reproducible reality.
