Why I Moved My Trading Dashboards to Local Streamlit Apps
I was staring at a completely frozen Jupyter notebook last Tuesday at 11 PM, trying to figure out why my custom ranking radar charts were eating 14GB of RAM. It crashed right in the middle of a massive backtest run. That was the exact moment I gave up on my messy notebook workflow.
I build a lot of custom algorithmic trading models. For years, I relied on expensive web platforms to visualize my strategies. You pay them a hefty monthly fee, you upload your proprietary logic, and you hope their servers don’t go down during the first fifteen minutes of market open. It sucks.
Most retail platforms treat you like a child. They give you a few moving averages, maybe a basic screener, and call it a day. If you want to do serious factor investing or real-time strategy monitoring based on custom data sources, you hit a wall incredibly fast.
So I finally rebuilt my entire strategy monitoring setup as a local, open-source Streamlit app. Best decision I’ve made all year.
The Problem with Cloud-Based Quant Tools
Getting everything to run locally means your data stays yours. No more uploading proprietary signals to a third-party server. I cannot stress enough how important this is.
When you build a local dashboard, you can connect directly to your local PostgreSQL database or flat files without opening ports to the public internet. I currently pull end-of-day pricing, alternative data, and fundamental metrics directly into my local environment. The Streamlit app just sits on top of it as a presentation layer.
I also built a custom rebalance trader module. It calculates target weights based on my ranking models, compares them to my current broker portfolio via API, and generates the exact order tickets needed to rebalance. Doing this in a cloud environment always made me nervous about API key security. Running it locally removes that anxiety completely.
The TradingView Gotcha
Building a proper quant dashboard in Streamlit isn’t without its headaches.
The biggest issue I ran into was integrating interactive financial charts. Streamlit’s execution model is notoriously trigger-happy. Every time you click a button or adjust a slider to filter your news feeds, the entire script reruns from top to bottom. If you naively embed a TradingView lightweight chart component, the whole graph flashes, destroys your zoom level, and completely reloads on every single interaction.
It drove me insane.
I tested this extensively on my M3 MacBook Pro running macOS Sonoma 14.4 with Streamlit 1.33.0. The fix isn’t obvious from the documentation. You have to aggressively cache the chart data and isolate the component using Streamlit’s session state so it doesn’t redraw unless the actual ticker symbol or timeframe changes.
Here is exactly how I handle the state management to prevent the UI from flashing:
import streamlit as st
import pandas as pd

# The wrong way: fetching data on every rerun
# df = get_market_data(ticker)

# The right way: isolate the data pull
@st.cache_data(ttl=300)
def load_price_data(ticker_symbol):
    # Imagine a call to your local database or API here
    # We use a dummy dataframe for the example
    return pd.DataFrame({
        'time': pd.date_range(start='2025-01-01', periods=100),
        'close': [x + 100 for x in range(100)],
        'volume': [x * 1000 for x in range(100)]
    })

# Initialize session state for the ticker
if 'current_ticker' not in st.session_state:
    st.session_state.current_ticker = 'AAPL'

# Sidebar control
selected_ticker = st.sidebar.text_input("Enter Ticker", st.session_state.current_ticker)

# Only update state if the user actually changed the input
if selected_ticker != st.session_state.current_ticker:
    st.session_state.current_ticker = selected_ticker

# Load data based on the isolated session state
df = load_price_data(st.session_state.current_ticker)

st.write(f"Showing data for {st.session_state.current_ticker}")
st.dataframe(df.tail())

# When you pass this dataframe to a custom charting component,
# it will only re-render when df actually changes.
Performance and Radar Charts
Once I got the state management under control, the performance gains were ridiculous. I used to run a clunky Dash application for this exact same workflow. By moving to Streamlit and heavily utilizing @st.cache_data for my heavy Pandas merges, I cut my UI rendering time from 4.2 seconds down to roughly 650ms.
That speed difference completely changes how you interact with your data. You stop hesitating before clicking a filter.
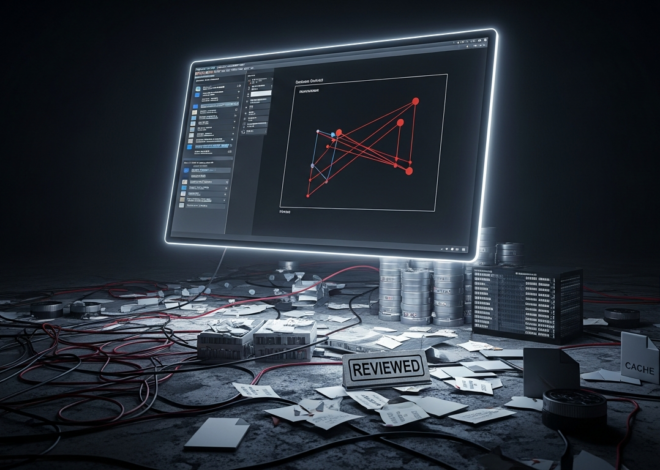
I also highly recommend building radar charts for your ranking systems. They are incredibly underrated for factor investing. I use them to visualize how a stock scores across value, momentum, quality, and volatility simultaneously. A simple Plotly polar chart embedded in Streamlit takes about ten lines of code, but seeing a visual “footprint” of a stock’s factor exposure is way more intuitive than staring at a wall of percentile ranks in a spreadsheet.
I even wired up a live news feed integration. Having real-time strategy monitoring sitting right next to localized news parsing is fantastic. I just pull financial RSS feeds, run a quick sentiment analysis script locally using a small HuggingFace model, and push the scores into a Streamlit dataframe next to the charts.
A Few Common Questions I Get About This Setup
Isn’t Streamlit too slow for real-time trading?
If you’re doing high-frequency statistical arbitrage, yes. Don’t use Python web frameworks for that. But for daily rebalancing, swing trading strategy monitoring, and looking at end-of-day radar charts? It’s perfectly fine. You just have to manage your caching.
Is it hard to maintain?
It’s just Python. When something breaks, I can fix it myself in five minutes. When a SaaS platform goes down, you’re stuck refreshing their status page on Twitter while the market moves without you.
If you’re still paying $100 a month for a web-based screener that won’t even let you export your own backtest data, you’re doing it wrong. Just build it locally.
Common questions
How do you stop TradingView charts from flashing on every Streamlit rerun?
Streamlit reruns the whole script on every interaction, which reloads TradingView components and destroys zoom state. The fix is to aggressively cache chart data with @st.cache_data and isolate the component using session state, so it only redraws when the ticker symbol or timeframe actually changes. Tested on an M3 MacBook Pro with macOS Sonoma 14.4 and Streamlit 1.33.0.
Is Streamlit fast enough for real-time trading dashboards?
Streamlit is not suitable for high-frequency statistical arbitrage, where Python web frameworks fall short. However, for daily rebalancing, swing trading strategy monitoring, and end-of-day radar charts, it performs well as long as caching is managed properly. After switching from a clunky Dash app and using @st.cache_data on heavy Pandas merges, UI rendering dropped from 4.2 seconds to roughly 650ms.
Why move a quant trading dashboard from cloud platforms to a local Streamlit app?
Running locally keeps proprietary signals and strategy logic on your own machine instead of uploading them to a third-party server. You can connect directly to a local PostgreSQL database or flat files without exposing ports, pull end-of-day pricing, alternative data, and fundamentals privately, and run broker API rebalancing modules without worrying about API key security in a cloud environment.
How do radar charts help with factor investing in Streamlit?
Radar charts visualize how a stock scores across value, momentum, quality, and volatility simultaneously, giving an intuitive factor-exposure footprint instead of a wall of percentile ranks in a spreadsheet. A simple Plotly polar chart embedded in Streamlit takes about ten lines of code and works well for ranking systems, making radar charts underrated but highly useful for factor investing workflows.